Use Cycling Statistics to Predict Race Results

Use Cycling Statistics to Predict Race Results
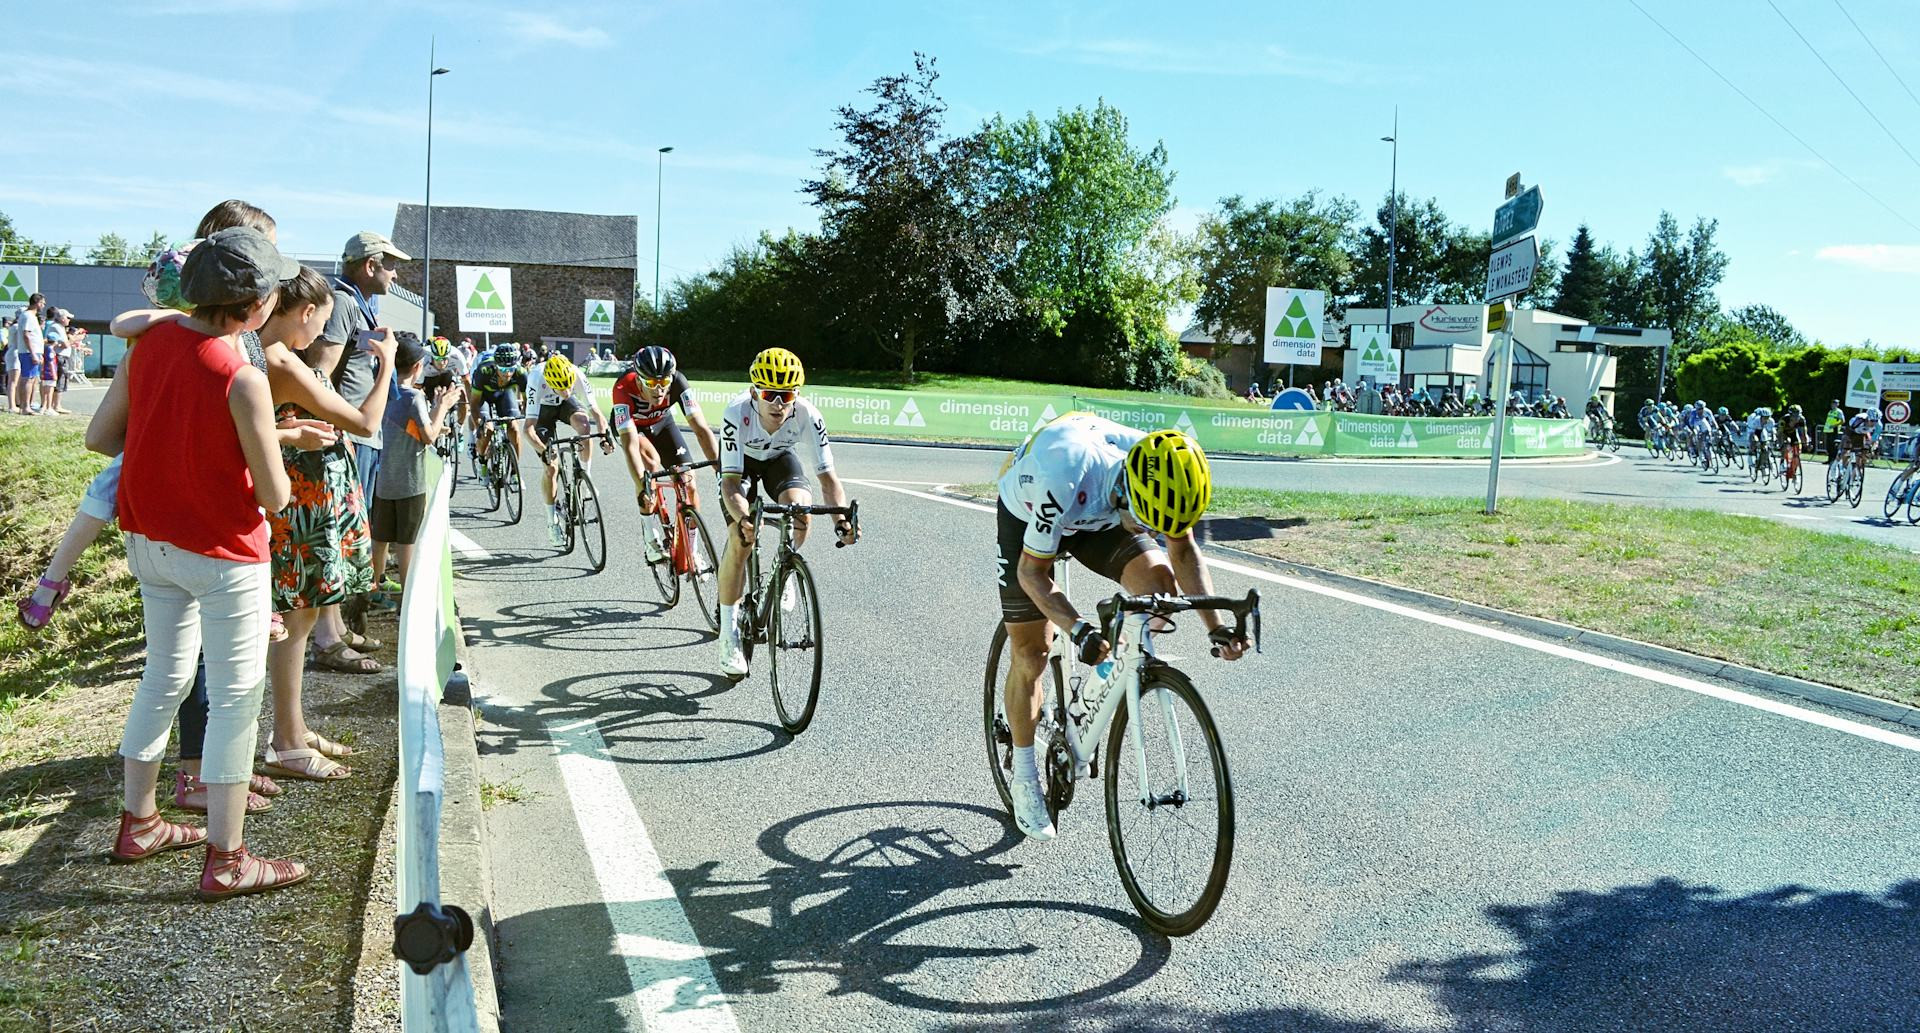
Cycling isn’t just about power and tactics anymore—it’s also about data. Today, enormous amounts of information are collected on riders’ performances, team strategies, and race characteristics. For fans and sports bettors alike, this opens a new world of possibilities: using cycling statistics to predict who will win the next race.
But how do you actually do that? And which data points matter most when trying to forecast results in a sport where everything from wind direction to a flat tire can change the outcome?
Understand the Key Metrics
When analyzing cycling races, a few statistics consistently stand out as the most important indicators of performance.
- Watts per kilogram (W/kg) – a measure of how much power a rider can produce relative to their body weight. This is especially crucial in mountain stages, where lighter riders with high W/kg values often have the edge.
- Time gaps in previous races – show how closely matched riders have been in similar stages or races.
- Performance by terrain type – some riders excel in hilly classics, while others dominate flat sprints or long climbs.
- Team strength – a strong team can protect its leader, control breakaways, and set up the right race situations. Statistics on team performance can therefore be just as valuable as individual form.
By combining these data points, you can start to build a picture of who has the best chances in a given race.
Use Historical Data as a Guide
One of the most effective ways to predict results is to look at historical patterns. Many riders have clear performance profiles: some consistently excel in certain races, while others struggle on specific types of stages.
For example, you can analyze how a rider has performed in previous editions of races like the Tour of California or the Critérium du Dauphiné. If a rider has repeatedly finished in the top 10, it’s a strong sign that the course suits their strengths.
It’s also important to consider recent form. A steady upward trend—shown through consistent results and strong power numbers—is often a better indicator than a single standout performance.
Weather, Route, and Tactics – The Hidden Factors
Even the best statistical models can’t predict everything. Weather conditions, wind direction, and route profiles play a huge role in cycling.
Take this example: a powerful sprinter might be the favorite on paper, but if the race features strong crosswinds and rolling terrain, the dynamics can change completely. Statistics showing how a rider performs under different conditions can add another layer of insight.
Tactics matter too. Some teams race aggressively and aim for breakaways, while others wait for the final climb. By analyzing team strategies from past races, you can better anticipate how the race might unfold.
How to Build Your Own Model
You don’t need to be a data scientist to get started. Many websites and apps offer open databases with cycling statistics, where you can find information on riders, teams, and races.
Start by choosing a focus area—say, one-day races or mountain stages—and gather data from the past few seasons. Use a simple spreadsheet to compare riders’ performances under similar conditions.
Over time, you can expand your model with more variables: weather data, team changes, injuries, and form trends. The more precisely you can describe the relationship between past performances and race characteristics, the better your predictions will become.
Læs også:
Statistics as a Tool – Not a Guarantee
While data analysis can provide a strong foundation, cycling remains unpredictable. A crash, a puncture, or a tactical masterstroke can turn everything upside down. Statistics should therefore be seen as a way to understand probabilities—not as a guarantee of the outcome.
That’s what makes the sport so captivating: even with all the data in the world, you can never fully predict who will cross the finish line first. But with a solid grasp of the numbers, you can get closer—and gain a deeper appreciation for why races unfold the way they do.
Læs også: